
Figure 2. CrkI and CrkII overexpression induces EMT via distinct regulation of Rac1 and RhoA.
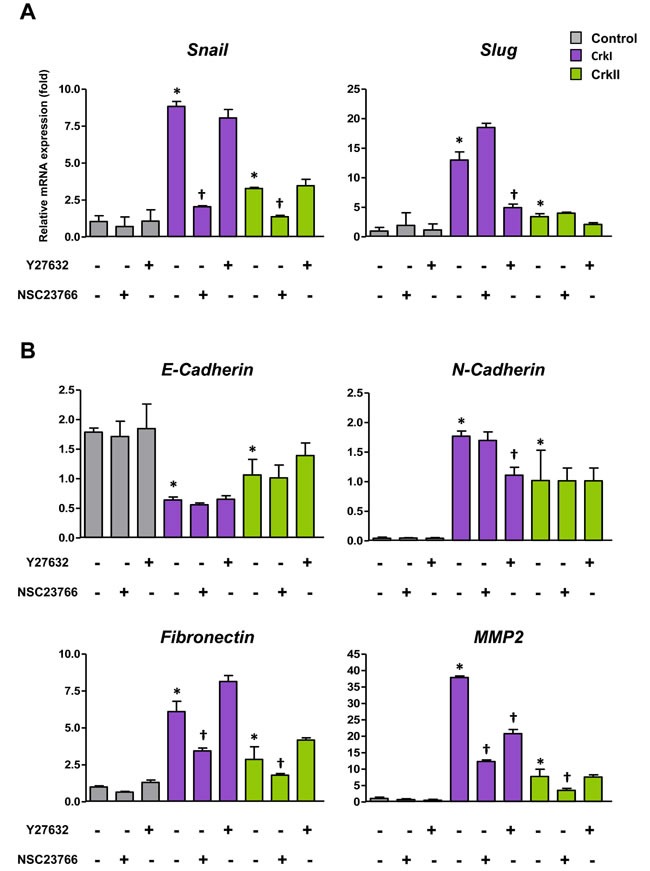
A. qRT-PCR analysis of mRNA expression of Snail and Slug. Effects of ROCK inhibitor Y27632 (10 μM) and Rac1 inhibitor NSC23766 (50 μM) were also analyzed. B. qRT-PCR analysis of mRNA expression of E-cadherin, N-cadherin, fibronectin, and MMP2. Values are means±SD from three independent experiments. *P < 0.05 versus control cells. †P < 0.05 versus untreated cells.