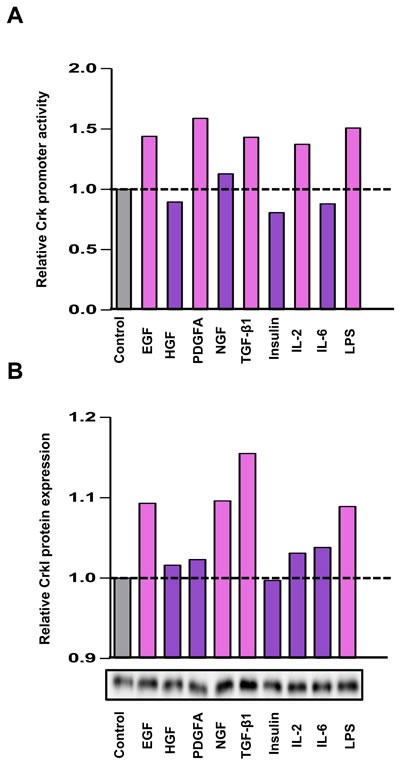
Figure 3. Various stimuli enhanced Crk expression.

A. Luciferase assay for the Crk promoter. Serum-starved A549 cells were stimulated with various growth factors and cytokines indicated below the panel, and dual-luciferase assays were performed at 24 h after stimulation. The relative promoter activities of Crk were displayed as bar graph. B. Expression levels of CrkI were analyzed by immunoblotting. After 48 h, expression levels of CrkI protein were examined. The results of immunoblotting are displayed as bar graph. Gray bar indicates control arbitrarily designated as 1.0, and a significant increase is indicated by pink color and a non-significant increase as purple color.
