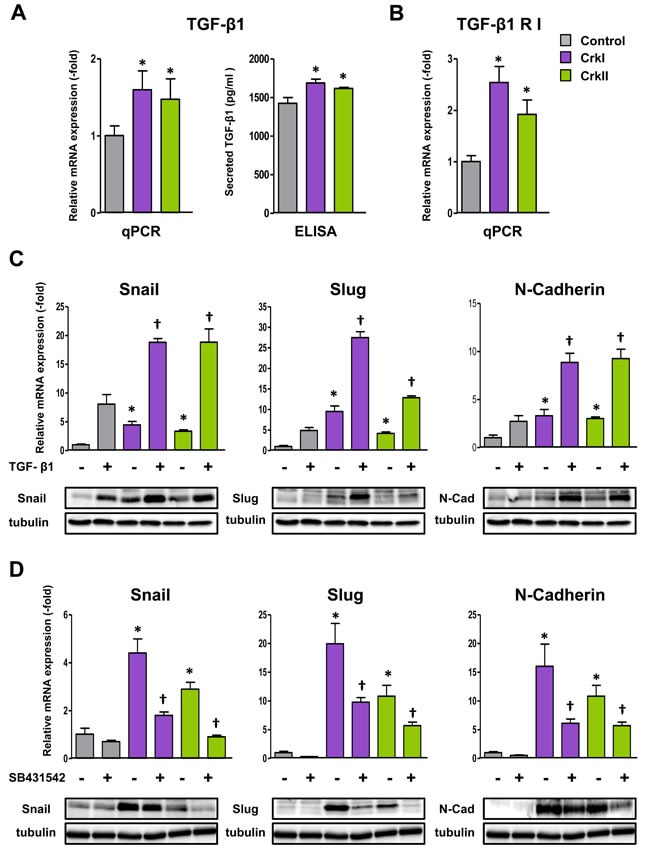
Figure 4. CrkI and CrkII upregulate the TGF-β1 signaling pathway through Rac1 and RhoA activation.

A. Increase of TGF-β1 expression as measured by qRT-PCR and ELISA in CrkI- and CrkII-expressing A549 cells. *P < 0.05 versus control cells. B. Increase of TGF-β receptor I (RI) expression in CrkI- and CrkII-expressing A549 cells. *P < 0.05 versus control cells. C. Effect of TGF-β1 on Crk-induced EMT. qPCR analysis of mRNA expression of Snail, Slug, and N-cadherin in CrkI- and CrkII-expressing A549 cells with 5 ng/mL of TGF-β1 treatment for 48 h. *P < 0.05 versus control cells. †P < 0.05 versus treated control cells. Immunoblot analysis of indicated proteins are displayed at the bottom. Tubulin was used as an internal control. D. Effect of TGF-βRI inhibitor on Crk-induced EMT. qPCR analysis of mRNA expression of Snail, Slug, and N-cadherin in CrkI- and CrkII-expressing A549 cells with treatment of 10 μM TGF-βRI inhibitor (SB431542) for 48 h. *P < 0.05 versus control cells. †P < 0.05 versus treated control cells. Immunoblot analysis of indicated proteins are displayed at the bottom. Tubulin was used as an internal control.
