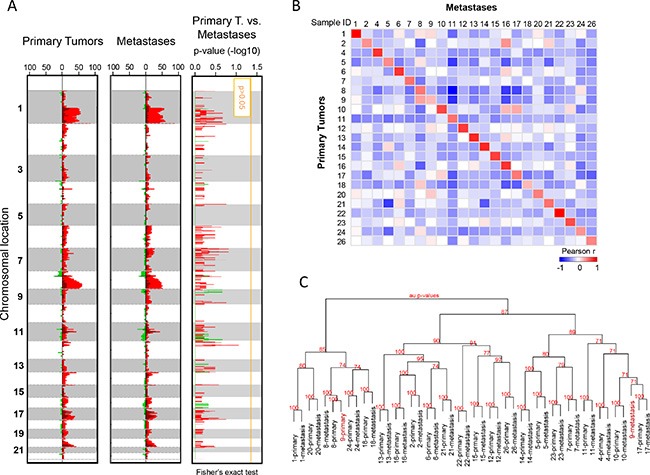
Figure 1. Copy number alteration profiles of primary tumors and metastases.

(A) Frequency plots of genome CNA. Frequencies (horizontal axis, from 0 to 100%) are plotted as a function of chromosome location (from 1 pter to the top, to 22 qter to the bottom), for all primary tumors (N = 23) and metastases (N = 23). Frequencies of tumors showing CNA are color-coded, with gains in light red, amplifications in dark red, losses in light green, and deletions in dark green. Right: Supervised analysis of CNA frequencies between 23 primary tumors and 23 metastases. Plotted values represent the –log10 p-values of the Fisher's exact test, in red for gained/amplified regions and green for lost/deleted regions. The vertical orange line represents the significance threshold. We did not identify any genomic segment significantly differentially altered between primary tumors and metastases. (B) Correlation matrix based on the CNA profiles (log2 ratios of all probes) generated between all primary tumors and all metastases: the Pearson coefficient is color-coded according to the scale shown below the matrix. (C) Dendrogram of the hierarchical clustering (R-package pvclust) of whole-genome CNAs measured for 46 samples (26 pairs). The AU (Approximately Unbiased) p-values provided by multiscale bootstrap resampling indicate the robustness of tumor clusters, larger the p-values, more robust the clusters.
