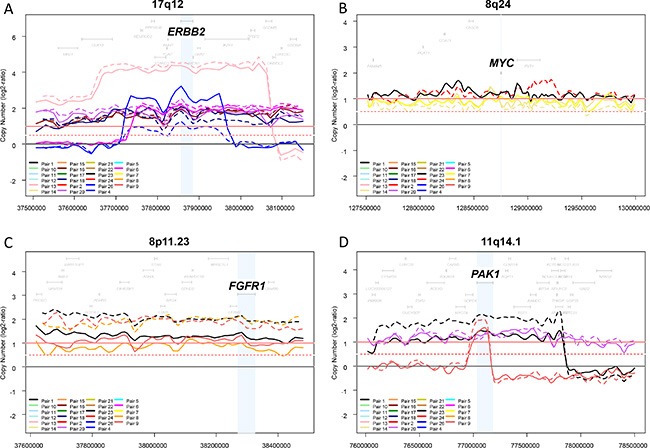
Figure 2. Genomic profiles within four regions frequently amplified in breast cancer.

The copy number profiles of each region (log2 ratios) were plotted for each of the 46 samples (23 pairs). Different colors correspond to different pairs, and the full line corresponds to the primary tumor and the dashed line to the metastasis. Four regions frequently amplified in breast cancer and one oncogene driver per region are shown: 17q12 and ERBB2 (A) 8q24 and MYC (B) 8p11.23 and FGFR1 (C) and 11q14.1 and PAK1 (D).
