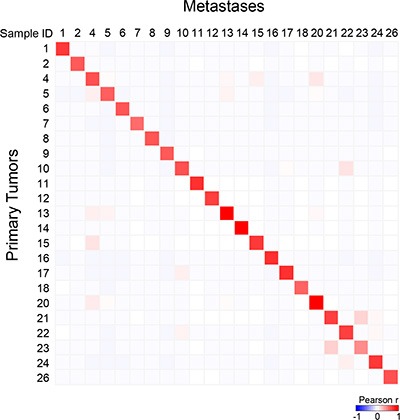
Figure 4. Correlation between each metastatic sample and all primary tumors with respect to mutational profiles.

Correlation matrix based on the variant allele frequency (VAF) for all detected variants generated between all primary tumors and all metastases: the Pearson coefficient is color-coded according to the scale shown below the matrix.
