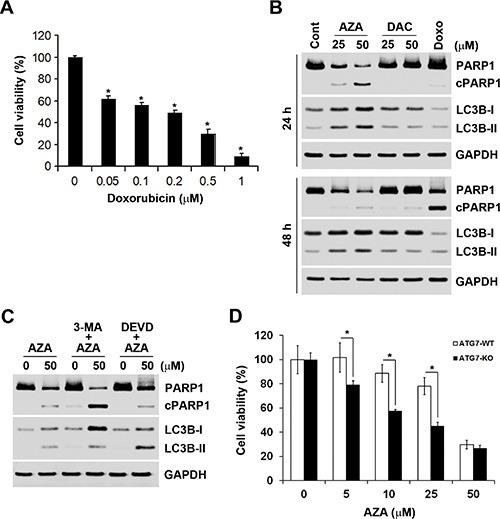
Figure 7. The relationship between apoptosis and autophagy induced by azacytidine (AZA).

(A) HCT116 cells were treated with different doses of doxorubicin for 72 h, and the cell viability was analyzed by an MTT assay. (B) HCT116 cells were treated with different doses of AZA or decitabine (DAC), or 0.5 μM doxorubicin for 24 and 48 h, and whole-cell lysates were subjected to a Western blot analysis using antibodies against PARP1, LC3B, or GAPDH. (C) HCT116 cells were pretreated with 5 mM 3-MA or 50 μM Z-DEVD-FMK for 1 h and then exposed to 50 μM AZA for 24 h. Whole-cell lysates were subjected to a Western blot analysis using antibodies against PARP1, LC3B, or GAPDH. (D) ATG7-WT and ATG7-KO DLD-1 cells were treated with different doses of AZA for 72 h, and cell viability was analyzed by an MTT assay.
