
Figure 4. Chemotaxis of neuroendocrine-like cells for tumor-associated macrophages.
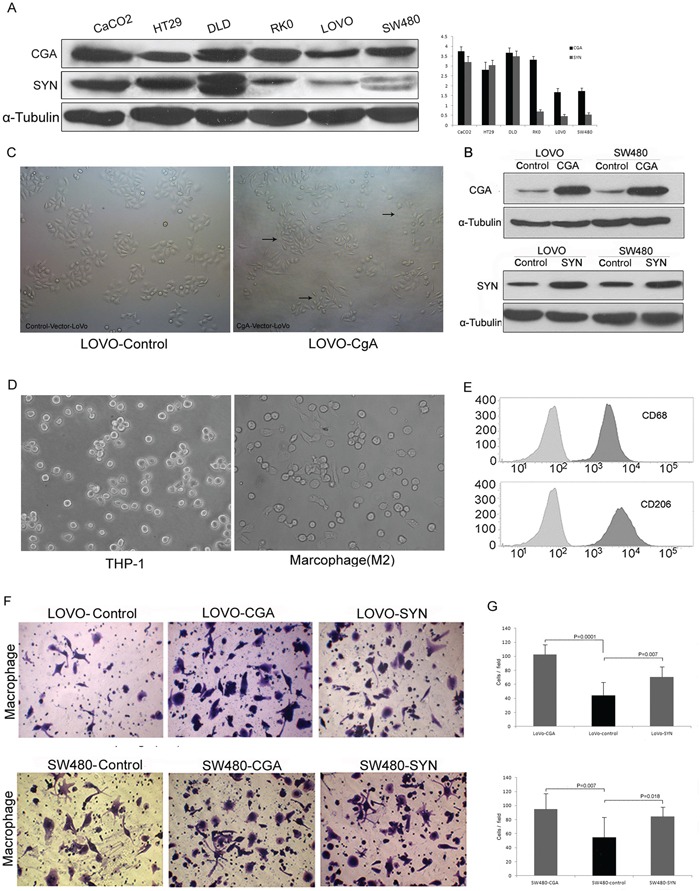
A. The expression of CgA and Syn in the 6 colon cancer cell lines. Bars correspond to the mean ± SD. B. Western blot was used to verify CgA or Syn expression in the stable colon cell lines. C. The morphological change of the neuroendocrine-like cell (LOVO-HA-CgA), which was similar to the tentacle-like protuberance of nerve cell. D. Normal conditions of THP-1 (left), and treated with PMA 320 nM for 6 h and then added IL-4 20 ng/ml for 18 h (right). E. The THP-1 showed significant induction for CD68 (for macrophages differentiation) and CD206 (for TAMs/M2 macrophages). F. Transwell assay was used to compare the TAM migration ability between LOVO/SW480-CgA or LOVO/SW480-Syn cells with LOVO/SW480-control cells. G. The numbers of cells passed through the Matrigel matrix. Bars correspond to the mean ± SD.