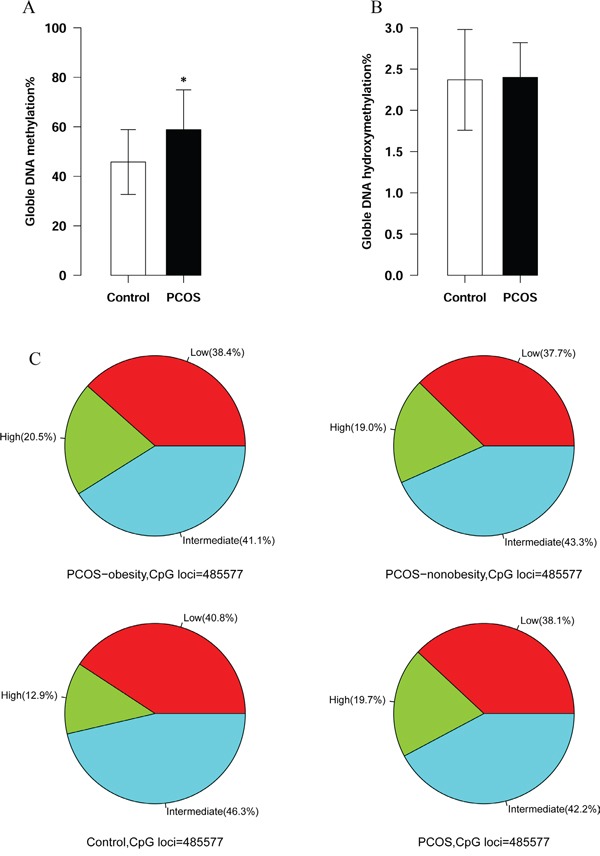
Figure 1. Global DNA methylation and hydroxymethylation between PCOS patients’ and Controls’ ovary granulosa cell.

A. Global DNA methylation of granulosa cell between PCOS patients and controls. The number of PCOS patients was 20 and controls were 20. P value <0.05 B. Global DNA hydroxymethylation of granulosa between PCOS patients and controls. The number of PCOS patients was 20 and controls were 20. P value >0.05 C. Hypermethylation CpGs distribution among PCOS-nonobesity, PCOS-obesity and Controls. (The hypermethylaiton of DNA methylation was defined lever above 0.8, the number of PCOS-obesity patients was 8, controls was 8 and PCOS-nonobesity was 8.)
