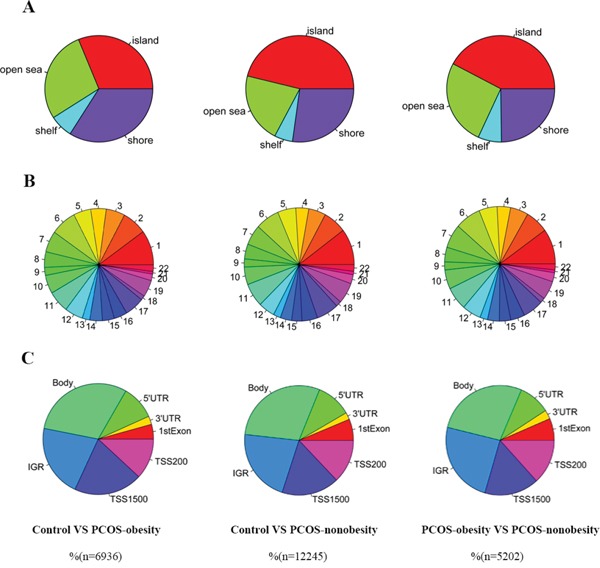
Figure 2. Different DNA methylation CpGs of granulose cells distribution in PCOS-obesity, PCOS-nonobesity and Control.

A. CpG content and neighbourhood context of CpG Island, shore, shelf and open sea distribution of different methylation CpG sites B. Different DNA methylation CpGs sites distribution across autosome (chromosome 1 to 22) C. Different DNA methylation CpGs sites gene structure: 5′UTR, 3′UTR, 1stExon, TSS200, TSS1500, IGR and gene body distribution. The number of PCOS-obesity patients was 8, controls were 8 and PCOS-nonobesity was 8.
