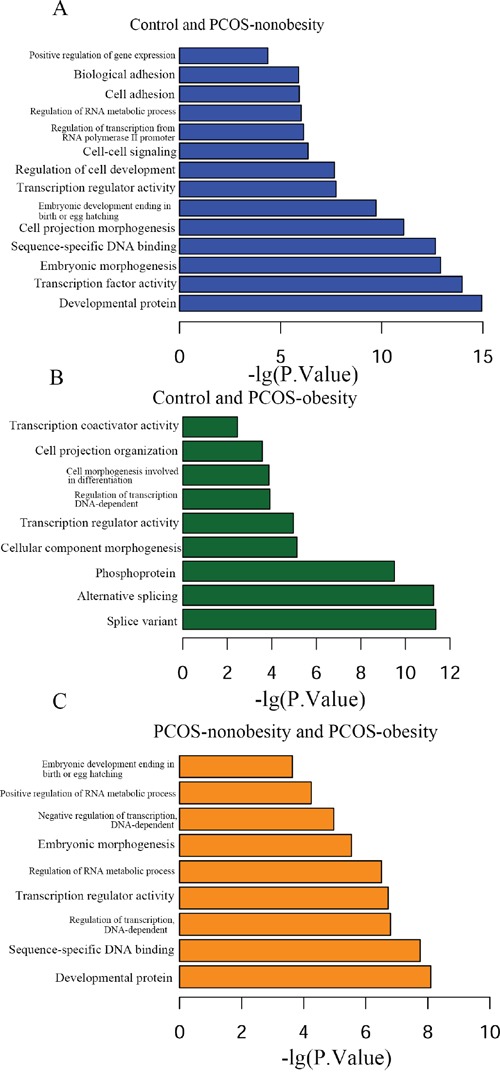
Figure 3. Functional analysis of different methylation sites of PCOS-obesity, PCOS-nonobesity and Control.

A. Different methylation sites between control and PCOS-nonobesity functional analysis using DAVID B. Functional analysis of different methylation sites between control and PCOS-obesity using DAVID C. Different methylation sites between PCOS-obesity and PCOS-nonobesity functional analysis using DAVID.
