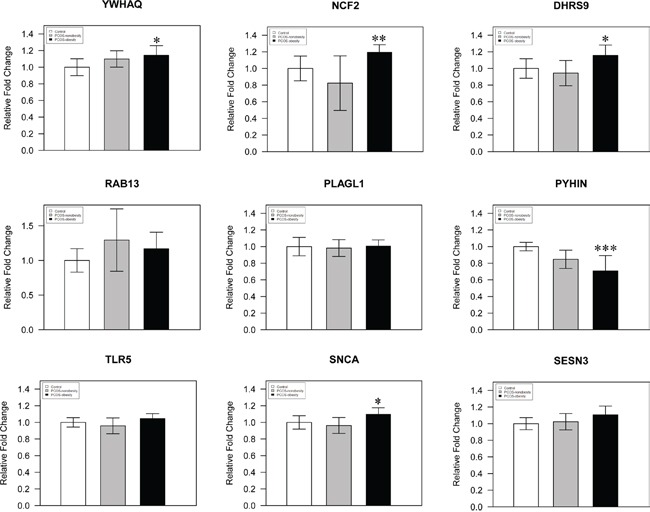
Figure 5. A histogram showing qPCR results of three groups for 9 selected genes.

The YWHAQ, NCF2, DHRS9, RAB13, PLAGL1, PYHIN, TLR5, SNCA and SESN3 were analyzed by Q-RT-PCR, using total 24 samples from PCOS-obesity patients, controls and PCOS-nonobesity, each group 8 samples. YWHAQ, DHRS9 and SCNA showed significantly higher in PCOS-obesity patients (P<0.05), NCF2 showed highly significant up-regulation in PCOS-obesity groups(P<0.01), while PYHIN exhibited most significantly down-regulation in PCOS-obesity groups(P<0.001).
