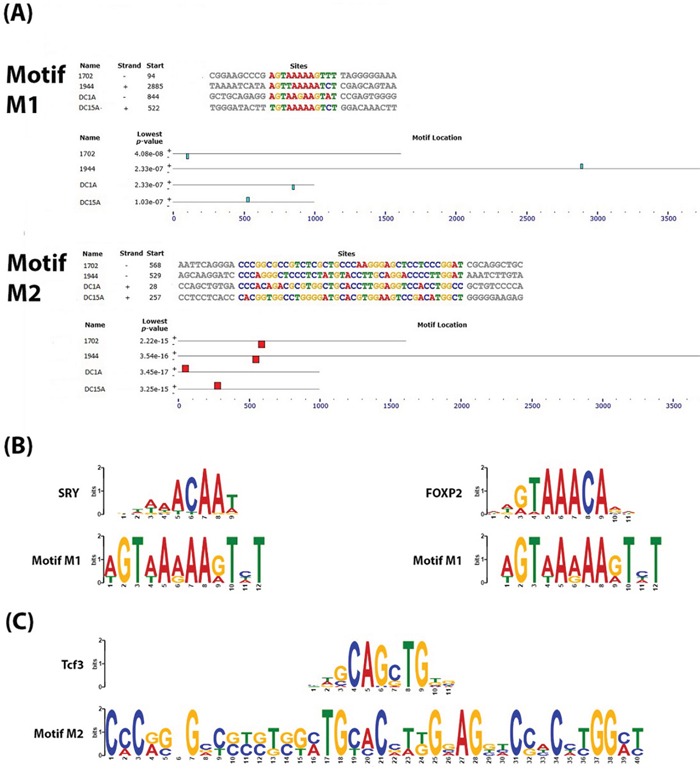
Figure 2. Conserved motifs identified within the DNA sequences of the enhancer-DMR pairs.

A. Output from an MEME analysis showing the relative location of 2 conserved motifs which we called “M1” and “M2” within the DNA sequences of the enhancers and DMRs. B. Output of TOMTOM analysis of M1 showing similarity of this motif to known validated transcription factor binding sites for SRY and FOXP2 (E-value >1) C. Output of TOMTOM analysis of M2 showing this motif to contain the transcription factor binding site for Tcf3 (E-value >1).
