
Figure 3. Histogram plots of read coverage per base for the 11 cell lines.
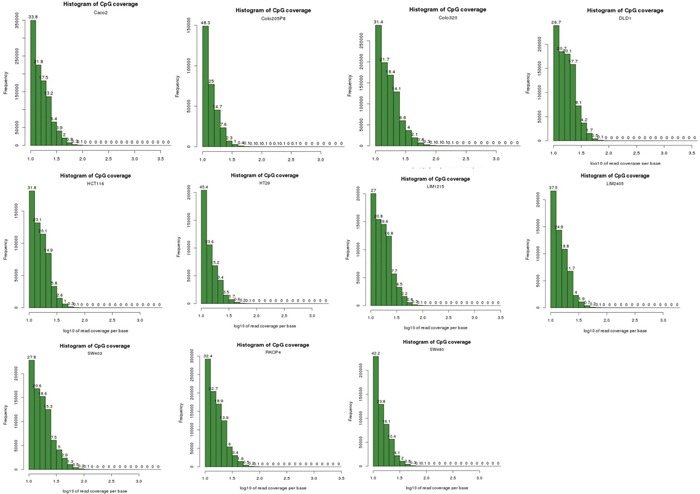
These histogram plots show that the NGS data for the 11 cell lines do not suffer from PCR amplification bias. Experiments that suffer from PCR duplication bias will have a secondary peak on the right-hand side of the histogram. As no secondary peak is observed in our data for all 11 cell lines, this indicates that our data do not suffer from PCR duplication bias.