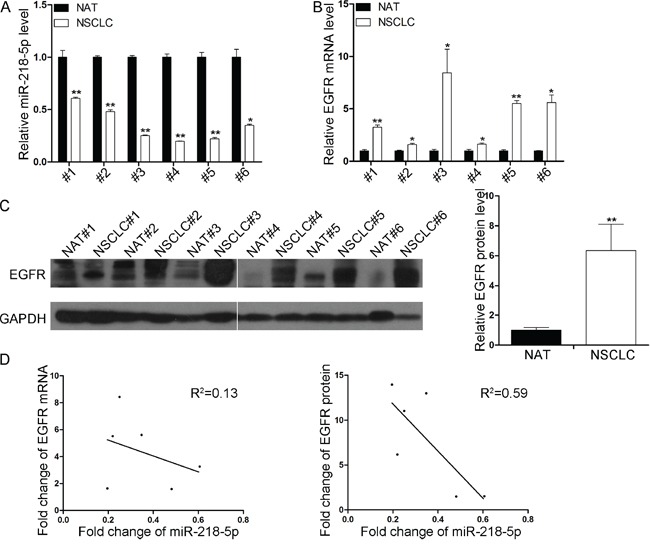
Figure 2. Inverse correlation between the miR-218-5p and EGFR protein expression levels in NSCLC tissues.

A. Quantitative RT-PCR analyses of the expression levels of miR-218-5p in 6 pairs of NSCLC and NAT samples. The results were normalized to U6 (*P < 0.05, **P < 0.01). B. Quantitative RT-PCR analyses of the expression levels of EGFR mRNA in 6 pairs of NSCLC and NAT samples. The results were normalized to GAPDH (*P < 0.05, **P <0.01). C. Western blotting analyses of the expression levels of EGFR protein in 6 pairs of NSCLC and NAT samples. Left panel: representative image; right panel: quantitative analysis (**P < 0.01). D. Pearson's correlation scatter plot of the fold change in miR-218-5p and EGFR mRNA (left) or protein (right) in human NSCLC tissues.
