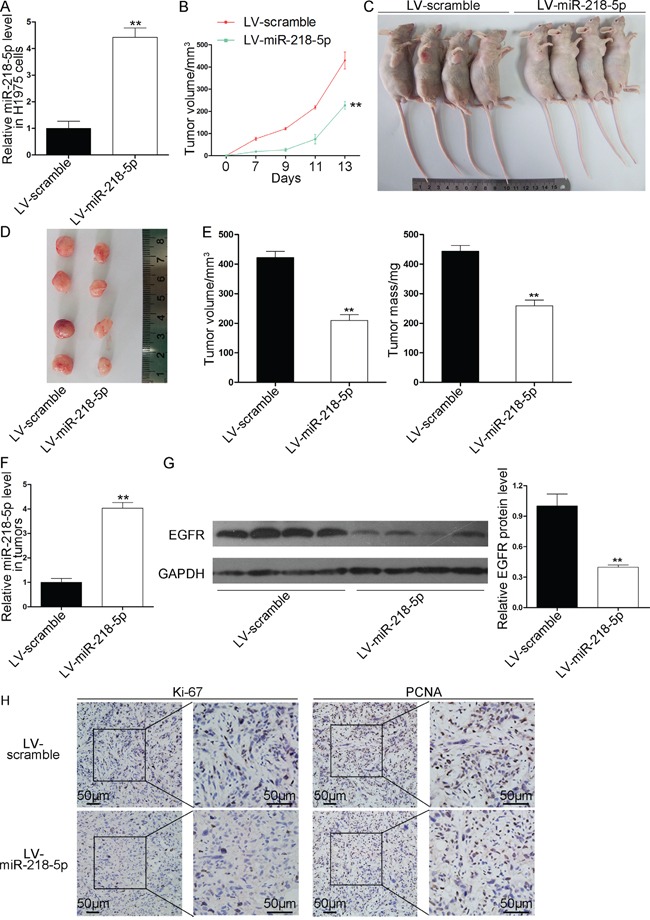
Figure 5. Effects of miR-218-5p on the growth of NSCLC xenografts in mice.

H1975 cells were infected with a control lentivirus or a lentivirus causing the overexpression of miR-218-5p. The infected H1975 cells (5 × 10⁶ cells per mouse) were implanted subcutaneously into nude mice (10 mice per group). Beginning on day 7 after implantation, the tumor lengths and widths were measured every 2 days for a total of 4 measurements, and the tumor growth curves were evaluated. At 13days after implantation, the tumors were dissected, and the exact sizes and weights were measured. A. Quantitative RT-PCR analyses of the miR-218-5p levels in the H1975 cells after infection with a control lentivirus or a lentivirus causing the overexpression of miR-218-5p (**P < 0.01). B. Tumor growth curves in the implanted mice (**P < 0.01). C and D. Representative images of the nude mice bearing xenograft tumors (C) and the excised tumors (D). E. Quantitative analyses of the tumor volumes and weights (**P < 0.01). F. Quantitative RT-PCR analyses of the miR-218-5p levels in the tumors from the implanted mice (**P < 0.01). G. Western blotting analyses of the EGFR protein levels in the tumors from the implanted mice. Left panel: representative images; right panel: quantitative analysis (**P < 0.01). H. Immunohistochemical staining analyses of Ki-67 and PCNA in the tumors from the implanted mice.
