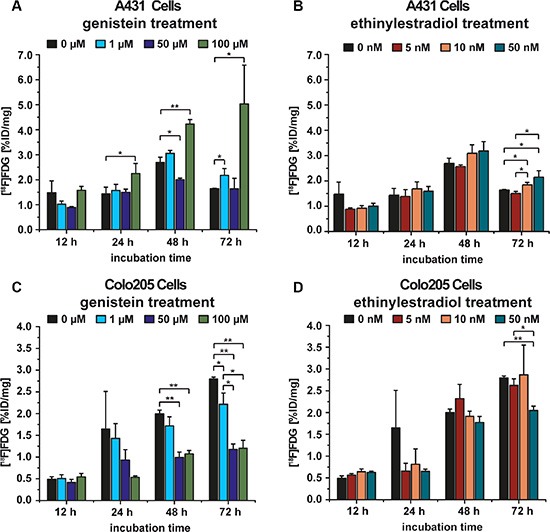
Figure 1. A431 and Colo205 cell culture experiments using the tracer [18F]FDG to monitor treatment effects of genistein or ethinylestradiol, respectively.

(A) [18F]FDG uptake of A431 cells after incubation with various concentrations of genistein for 12 h, 24 h, 48 h, and 72 h; (B) [18F]FDG uptake of A431 cells after incubation with different concentrations of ethinylestradiol for 12 h, 24 h, 48 h, and 72 h; (C) [18F]FDG uptake of Colo205 cells after incubation with different concentrations of genistein for 12 h, 24 h, 48 h, and 72 h; (D) [18F]FDG uptake of Colo205 cells after incubation with various concentrations of ethinylestradiol for 12 h, 24 h, 48 h, and 72 h. Data are shown as mean ± standard deviation (SD).
