
Figure 1. YY1 overexpression induces apoptosis in pancreatic cancer cells in vitro and in vivo.
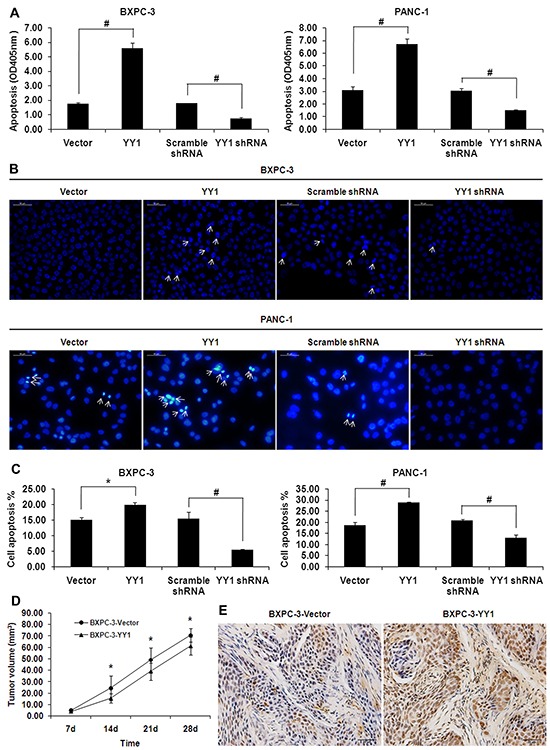
A. DNA fragmentation was measured by Cell Death ELISA. Results are representative of three independent experiments and are presented as the mean ± SD (bars). *p< 0.05; #p< 0.01. B. Changes in nuclear morphology were measured by Hoechst 33258 staining. Arrowheads indicate apoptotic cells characterized by morphological changes such as chromatin condensation and nuclear fragmentation. Results are representative of three independent experiments. C. Percentages of apoptotic cells in Annexin V-FITC/PI staining assay were detected by flow cytometry. Results are representative of three independent experiments and are presented as the mean ± SD (bars). *p< 0.05; #p< 0.01. D. Volumes of tumors grown from BXPC-3-Vector and BXPC-3-YY1 cells bilaterally injected into the flank region of the mice (1.5×10⁶ cells/100 μl per flank). Data are presented as means ± SD of tumors for each group. *p<0.05. E. Apoptosis in mouse xenograft tumor tissues was detected by in situ TUNEL assay.