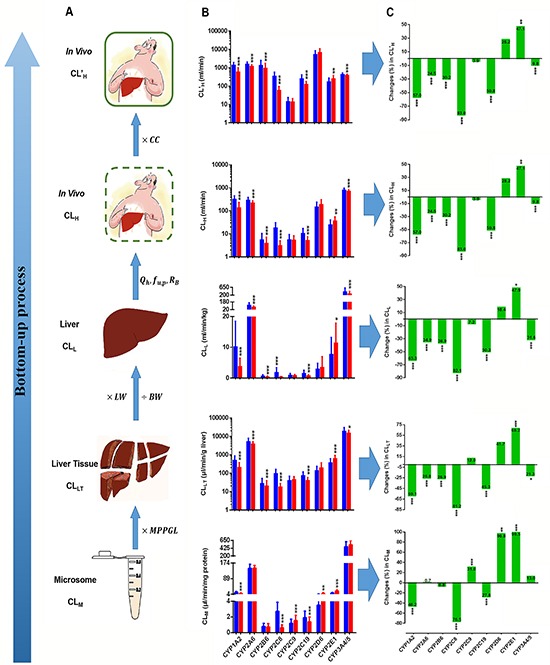
Figure 1. The bottom-up process (A), Clearance for CYPs at different levels in hepatocellular carcinoma (HCC) patients and control subjects (B) and changes in clearance rates at different levels in HCC patients (C).

CLM: clearance at the microsomal level; MPPGL: microsomal protein per gram of liver; CLLT: clearance at the liver tissue level; LW: liver weight; BW: body weight; CLL: clearance at the liver level; QH: hepatic blood flow; fu, p: fraction unbound in plasma; RB, ratio of the drug concentration in blood to plasma; CLH: clearance in vivo; CC: correction coefficient; CL’H: corrected clearance in vivo. The clearance for CYPs are expressed as medians with the inter-quartile range. A blue bar represents clearance in controls; a red bar represents clearance in the HCC group. “*”, “**”, and “***” indicate significant differences from controls (P<0.05, P<0.01, and P<0.001, respectively) by the Mann–Whitney U test.
