
Figure 2. Individual fold-error (IFE) of CLH and corrected individual fold-error (IFE’) of CL'H for the 10 CYPs in control subjects (n=105).
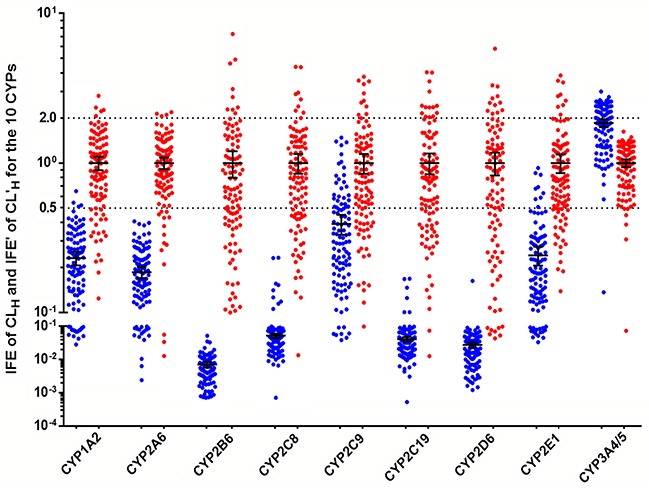
; . The blue ball represents the IFE, the red ball represents the IFE’. The black horizontal lines represent the mean with 95% confidence interval.