
Figure 2. FGFR2 colocalized with known GCSC markers (CD44, EpCAM) and FGFR2 positive cells had enlarged cell volumes.
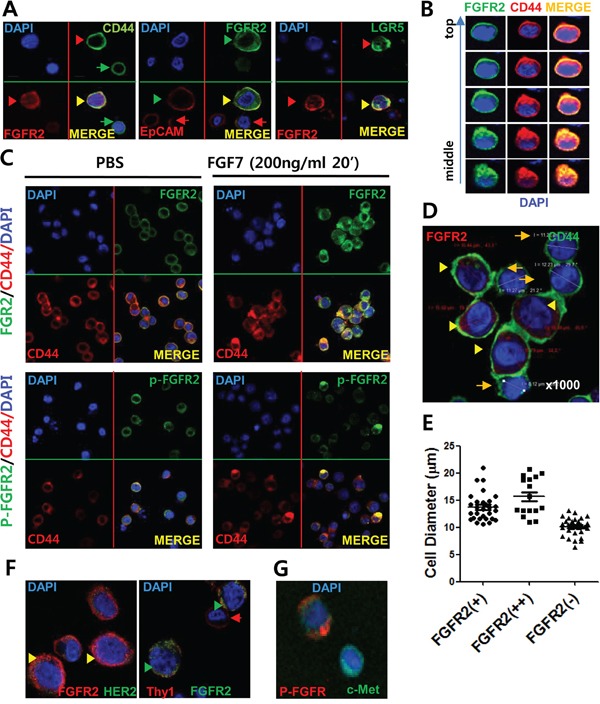
A. IF staining revealed colocalization of surface FGFR2 with GCSC markers (CD44, EpCAM) and intestinal stemness protein LGR5, but not with HER2 or Thy1. FGFR2 was expressed in both the cytoplasm and plasma membrane. Double positive cells with strong FGFR2 (FGFR2+/hi) and any level of CD44, EpCAM, and LGR5 expression usually displayed enlarged cell volumes (denoted with arrowhead ►) than FGFR2−/low cells (denoted as arrow →) (See also Figure S4). B. Z stack image analyses of confocal data revealed colocalization of surface FGFR2 with surface CD44. Topology from cell top to middle equator is shown. C. FGF7-induced FGFR aggregates with CD44 in SNU-16 cells. Phosphorylated FGFR2 (p-FGFR2) colocalized as a punctate form in a periplasmic site in cytoplasm. (See more experimental replicates in Figure S4B, Figure 5D, and Figure 6B). D. Enlarged cell volume in FGFR2-expressing cells compared to FGFR2-nonexpressing cells. E. Average diameter of SNU-16 cells showing FGFR2 (++) (strong positive), FGFR2 (+) (positive), and FGFR2 (−) (negative) staining from IF microscopic analyses. Diameters of FGFR2++ (mean 15.8 μm), FGFR2+ (mean 14 μm), and FGFR (−) (mean ∼10 μm) cells were determined from 50 cells per fraction by confocal staining. In A to D, nuclei were visualized by DAPI (blue color). Indicated proteins with green color and red colors were visualized by antibodies conjugated with Alexa-Fluor 488 (or FITC) and Alexa-Flour 588 (or APC), respectively (See Table S1 for detail). F. No apparent colocalization of surface FGFR2 with HER2 or Thy1. Note low HER2 expression in this SNU-16 cell. G. No apparent association of punctate p-FGFR2 and diffuse EpCAM in response to FGF7.