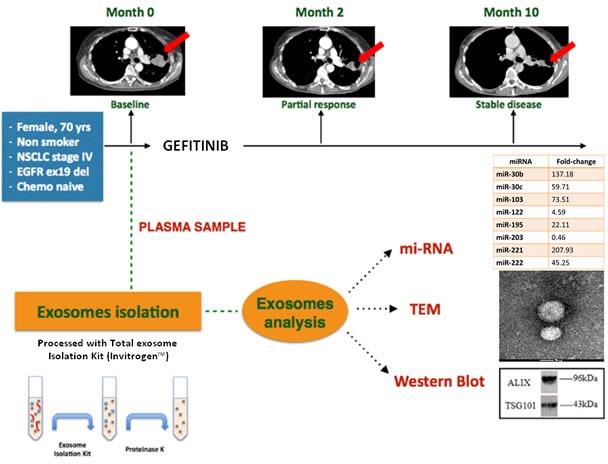
Figure 3. Summary of clinical case report.

The upper part of the figure shows the computerized tomography evolution. The patient achieved a partial response in 2 months, disease has been stable for 8 more months. The lower part shows a short scheme of exosome isolation and the morphological and biochemical analysis of the exosomes collected by the plasma of NSCLC patient. The miRNAs expression fold-change, relative to the baseline timepoint, is related to healthy control samples.
