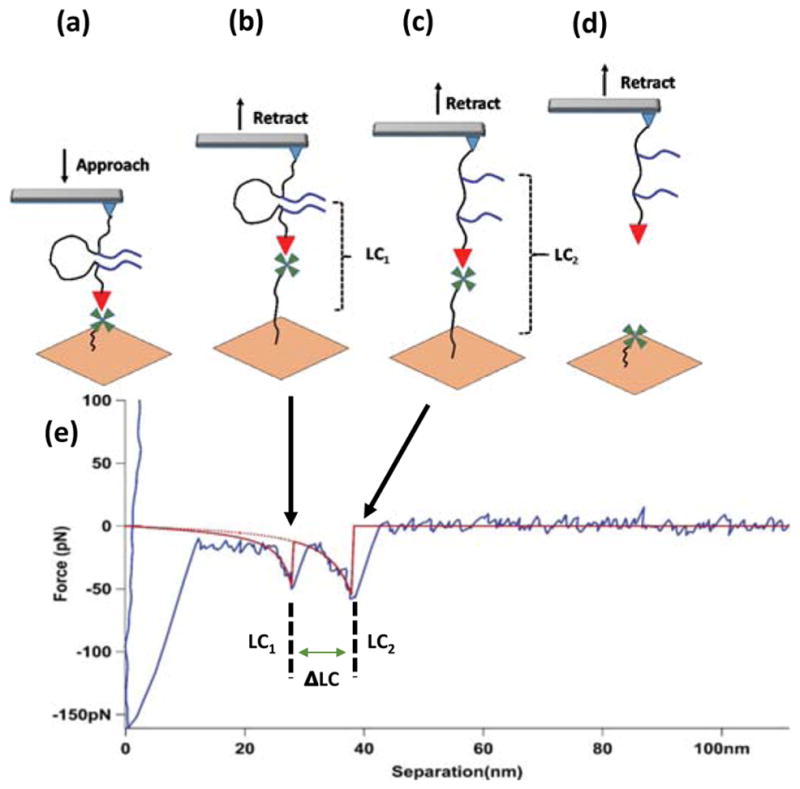
Figure 4.

AFM force spectroscopy experiment. (a) The AFM tip functionalized with FNA and terminated with biotin (red triangle) approaches the streptavidin-coated (green) surface; (b) Representation of events during retraction, just before the Aβ(14–23) rupture event; (c) Representation of events before the biotin-streptavidin link rupture; (d) Representation of molecules after two successive complex rupture events; (e) A representative force vs. distance curve (retraction) showing two peaks, the red lines indicate WLC fitting. LC1 and LC2 represent the contour length for the first and second peak, respectively. ΔLC represents (LC2 - LC1), which is equal to the length of the loop between the two strands of the peptide. The two arrows indicate possible situations for two peaks in the force vs. distance curve.
