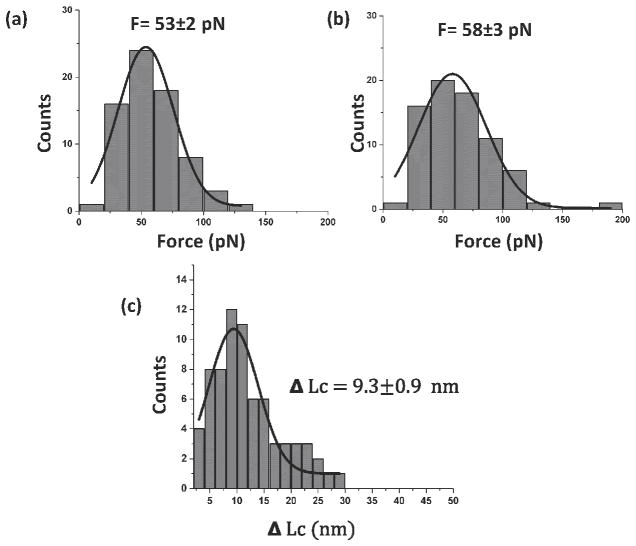
Figure 5.
Statistical analysis of the force spectroscopy experiments. (a) Histogram of the force distribution for the rupture of Aβ(14–23) dimers. The data are approximated with a Gaussian, producing an average force of 53 ± 2 pN; (b) Histogram for biotin-streptavidin unbinding events, with an average force of 58 ± 3 pN; (c) Histogram for the distance between the two rupture events; the average value is 9.3 ± 0.9 nm. All of the histograms were fitted with the Gaussian function and SEM is shown. The number of curves used for each histogram is 74.

