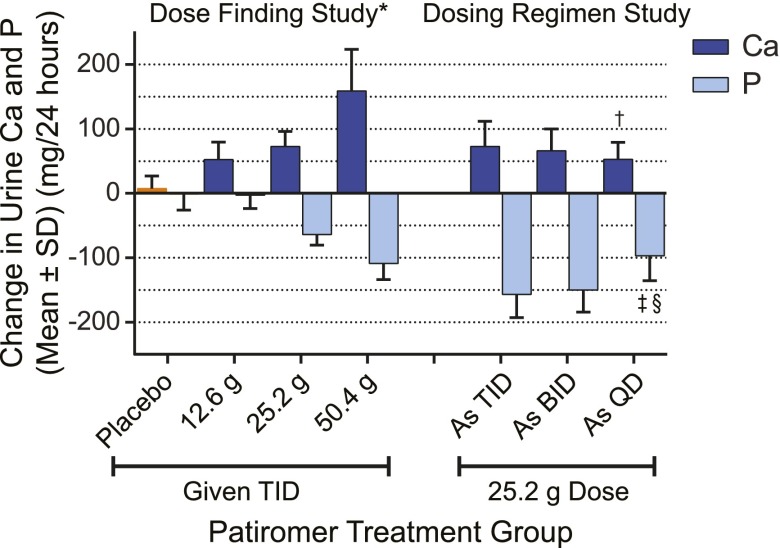
Figure 3.
Change in urine calcium and phosphate excretion. Mean±SD change in urine calcium (Ca) and phosphate (P) excretion by patiromer dose compared with baseline for both studies (preplanned analyses). Data are from Tables 1 and 3. BID, two times per day; QD, daily; TID, three times per day. *P<0.01 for overall test of patiromer dose differences from analysis of covariance; †P=0.01 versus three times per day for pairwise comparison between regimens from t test; ‡P<0.01 versus three times per day for pairwise comparison between regimens from t test; §P=0.02 versus two times per day for pairwise comparison between regimens from t test.

