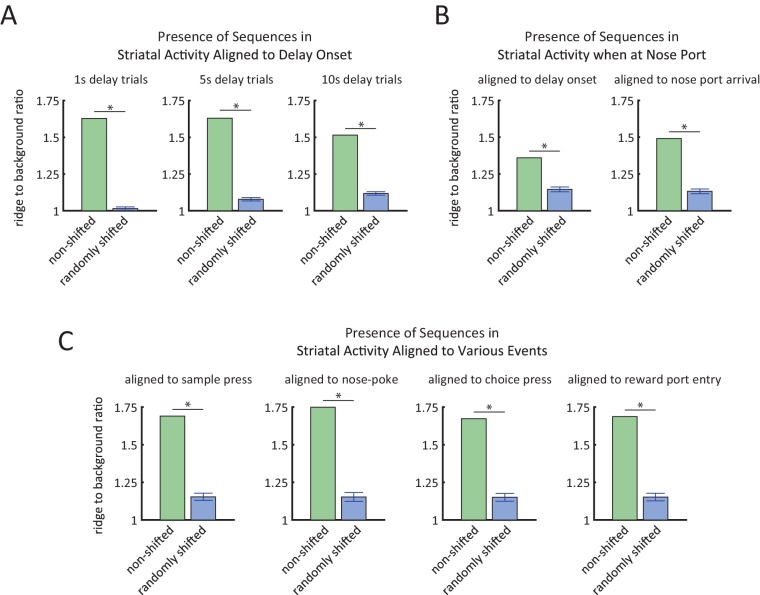
(
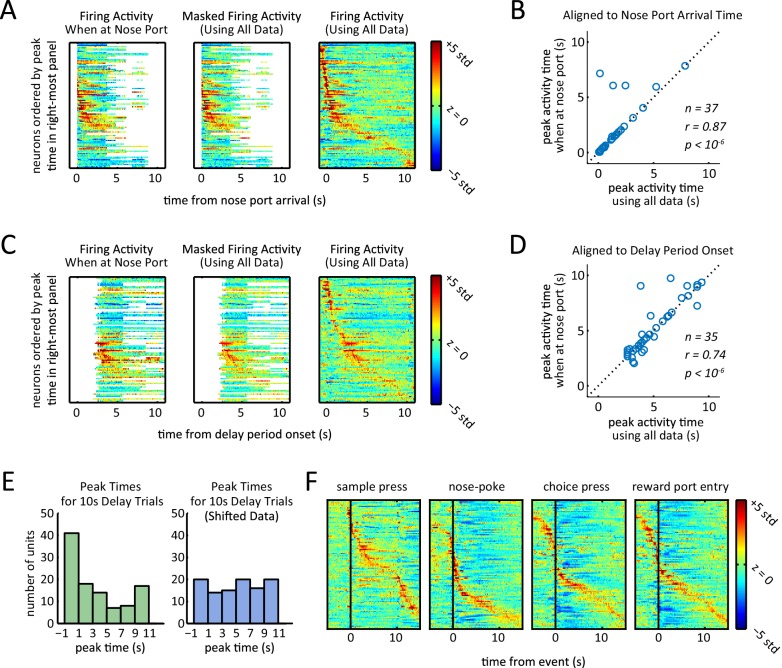
A) Z-scored firing rates when aligned to first nose port arrival. Each row corresponds to one neuron. Left-most plot was generated by only using data from times that the rat was at the nose port. White area corresponds to when the rat was not at the nose port for a sufficient amount of time to estimate firing rates (fewer than 25 left trials and 25 right trials). Middle plot was generated using data from all times regardless of the rat position, but time bins were masked to match masking of left plot. Right-most plot was generated using all data without any masking. Rows are ordered based on the time of their peak firing rate in right-most plot. (
B) Peak activity time when rat was in the nose port (left plot of panel
A) was significantly correlated with peak activity time calculated using all data (middle plot of panel
A) (r = 0.87, p<10
–6 Pearson correlation test). Neurons that had their peak activity fall in the masked time bins (white area in middle heat-map of panel
A) were excluded (n = 37). (
C) Same as panel
A, but aligned to delay period onset (sample lever press). (
D) Same as panel
B, but aligned to delay period onset (sample lever press). Peak activity time when rat was in the nose port (left plot of panel
B) was significantly correlated with peak activity time calculated using all data (middle plot of panel
B) (r = 0.74, p<10
–6 Pearson correlation test). Neurons that had their peak activity fall in the masked time bins (white area in middle heat-map of panel
A) were excluded (n = 35). (
E) Histogram of peak times for 10 s-delay trials for non-shifted data (
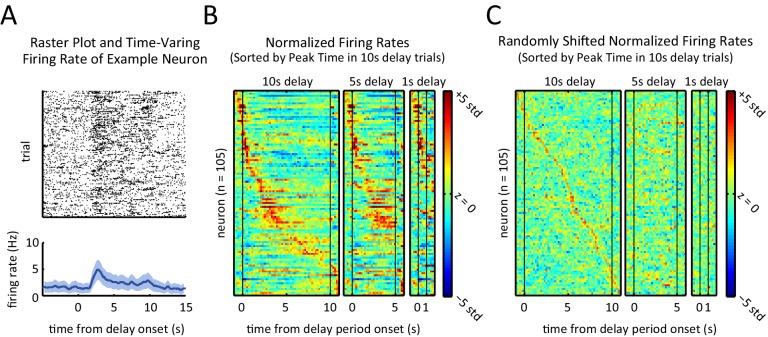
Figure 3B) and randomly shifted data (
Figure 3C). Comparison of histograms reveals the peaks were biased towards the beginning of the delay period (p<0.02; Wilcoxon rank sum test). (
F) Normalized firing rates of all neurons triggered to different events of the task. Rows in each plot are sorted by time of peak firing rate. Notice that aligning to sample press time is the same as aligning to delay period onset for all delay period lengths.


