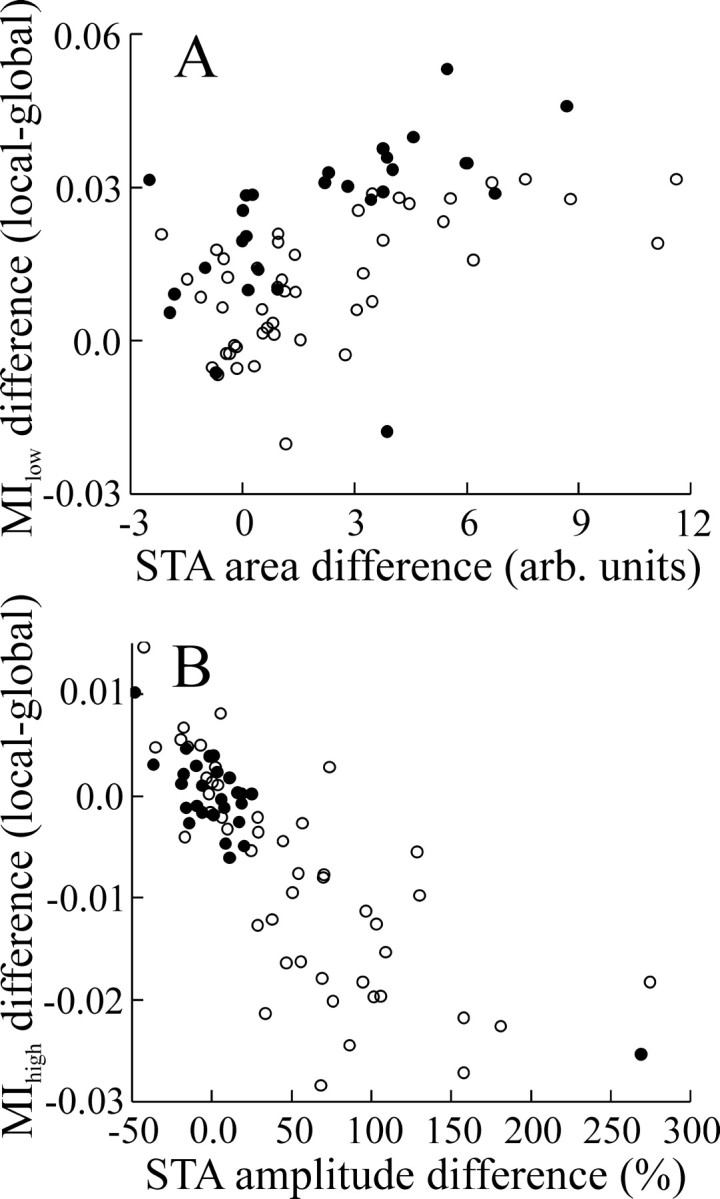
Figure 5.

Plots of changes in mutual information measures versus changes in STA features. A, Change in MIlow (local-global) as a function of change in STA area (r = 0.53; n = 76; p ≪ 10-3). B, Change in MIhigh versus percentage change in STA p-p amplitude (r = -0.78; n = 76; p ≪ 10-3). Open symbols indicate data from E cells; filled symbols indicate data from I cells. arb. units, arbitrary units.
