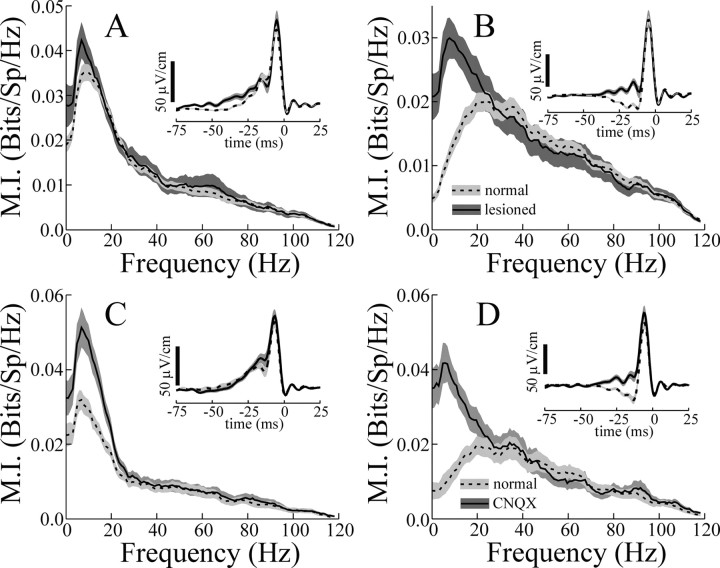
Figure 6.
A-D, The effects of surgical (A, B) and pharmacological (C, D) disruption of electrosensory feedback to the ELL. Data from E and I cells were pooled. A, Responses to local stimulation. Dashed line, Average MI curve from the population of normal cells studied (n = 77). Solid line, Average MI curves from experiments in which descending feedback was lesioned. Fp, Bw, MIlow, and MIhigh values averaged 11.3 ± 2.7 and 33.1 ± 5.1 Hz and 0.033 ± 0.003 and 0.010 ± 0.002 bits/Sp/Hz, respectively (n = 21). sp, Spike. These values did not differ significantly from the mean values from the population of normal cells studied (Table 2). Inset, Mean STAs from these same data sets. B, Responses of the cell populations of A to global stimulation. Line types have the same meaning, and gray areas indicate ± 1 SEM. Fp, Bw, MIlow, and MIhigh values averaged 13.6 ± 2.2 and 43.2 ± 6.0 Hz and 0.026 ± 0.003 and 0.013 ± 0.002 bits/Sp/Hz, respectively (n = 21). Inset, Mean STAs from the same data sets. C, Dashed and solid lines indicate mean mutual information curves during local stimulation from 23 pyramidal cells before and during CNQX blockade, respectively, of descending excitation to the ELL molecular layers. Frequencies of MI curve peak are Fp = 12.0 ± 2.7 and 12.6 ± 3.1 Hz before and during CNQX blockade, respectively (p = 0.61). Bandwidths at half maximum are Bw = 30.3 ≥5.0 and 25.0 ± 4.3 Hz before and during CNQX blockade, respectively (p = 0.98). MIhigh values = 0.009 ± 0.0013 and 0.009 ± 0.0015, respectively (p = 0.47). MIlow values = 0.026 ± 0.002 and 0.041 ± 0.009, respectively (p ≪ 10-3). D, Dashed and solid lines indicate mean mutual information curves given global stimulation before and during CNQX blockade, respectively. Fp normal = 31.8 ± 4.9 Hz, Fp CNQX = 15.5 ± 3.2, p ≪ 10-3; Bw normal = 48.4 ± 4.0, Bw CNQX = 31.6 ± 4.7, p = 0.009; MIlow normal = 0.013 ± 0.002, MIlow CNQX = 0.034 ± 0.003, p ≪ 10-3; MIhigh normal = 0.014 ± 0.002, MIhigh CNQX = 0.013 ± 0.003, p = 0.37. All p values are from pairwise t tests.

