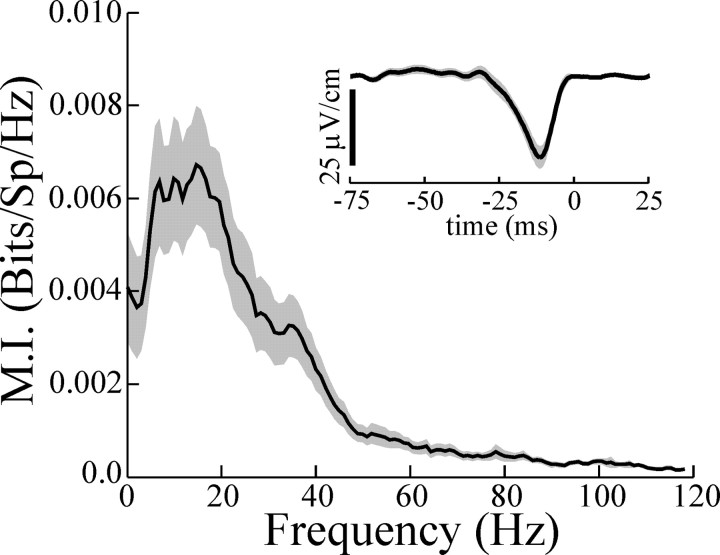
Figure 7.
Mean MI curve and STA resulting from global stimulation of pyramidal cells with ipsilateral receptor-afferent input removed. Latency from STA minimum to spike time averaged 13.0 ± 1.7 ms. The latency of normal cells from STA minimum to spike time was not different, averaging 13.7 ± 1.1 ms (p = 0.73; t test; df = 101). The latency of normal cells from STA principal peak to spike time was significantly shorter, averaging 4.5 ± 0.2 ms (p < 0.001; t test; df = 102). The width of the STA averaged 14.3 ± 1.8 ms and was slightly greater than the width of the dip of STAs from normal cells, which averaged 10.2 ± 0.9 ms (p = 0.03; t test; df = 103), but was far greater than the width of the principal STA peak of normal cells, which averaged 5.8 ± 0.1 ms (p < 0.001; t test; df = 103). Gray areas indicate ± 1 SEM. bits/Sp/Hz, Bits per spike per hertz.

