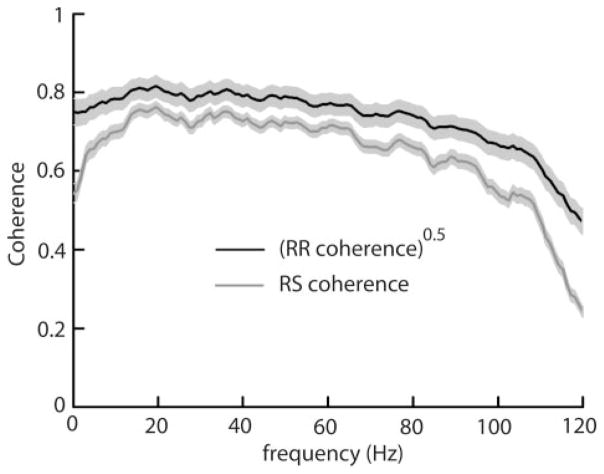
FIG. 1.
Population averaged (n = 41) square rooted RR coherence (black) and SR coherence (gray) curves for receptor afferents under global stimulation. On a scale ranging between 0 and 1, the SR coherence quantifies the performance of linear encoding models while the square rooted RR coherence measures the variability that cannot be accounted for by the stimulus and thus gives an upper bound on the SR coherence (see text for explanation). Both curves are qualitatively similar in shape showing a weakly low-pass response. Light gray bands show ± 1 SE.

