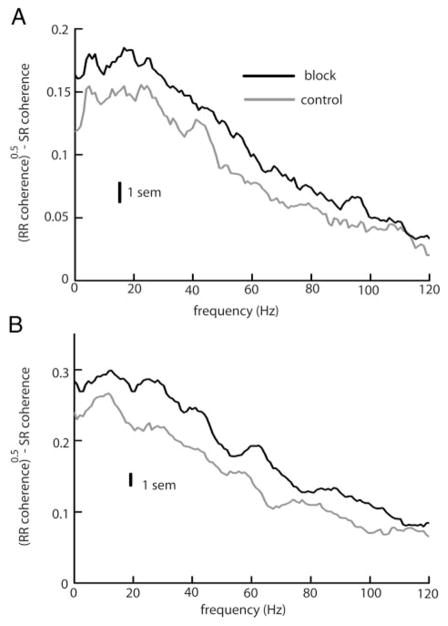
FIG. 4.
A: population averaged (n = 10) differences between the square rooted RR coherence and the SR coherence under control (gray) and block (black) for local stimulation. B: population averaged (n = 10) differences between the square rooted coherence and the SR coherence under control (gray) and block (black) for global stimulation. Vertical bars indicate the SE measured at 10 Hz.

