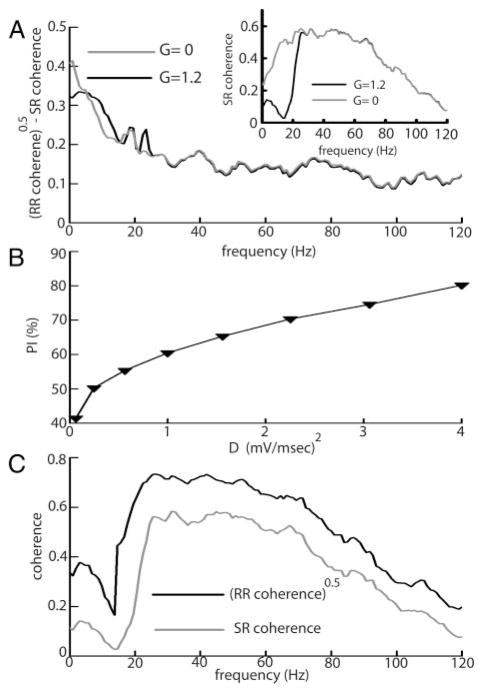
FIG. 9.
A: difference between the square rooted RR coherence and SR coherence curves with (black) and without (gray) the negative image in the model. We used Gneg = 1.2 mV when the negative image was present and Gneg = 0 mV when it was absent. Inset: SR coherence with (black) and without (gray) the negative image. B: performance index PI as a function of synaptic noise intensity D. Parameter values were the same as in Fig. 8B. C: square rooted RR (black) and SR (gray) coherence curves of the model under “global” stimulation. We used D = 0.01 (mV/ms)2 and other parameter values are given in the column “global” of Table 1.

