Figure 1.
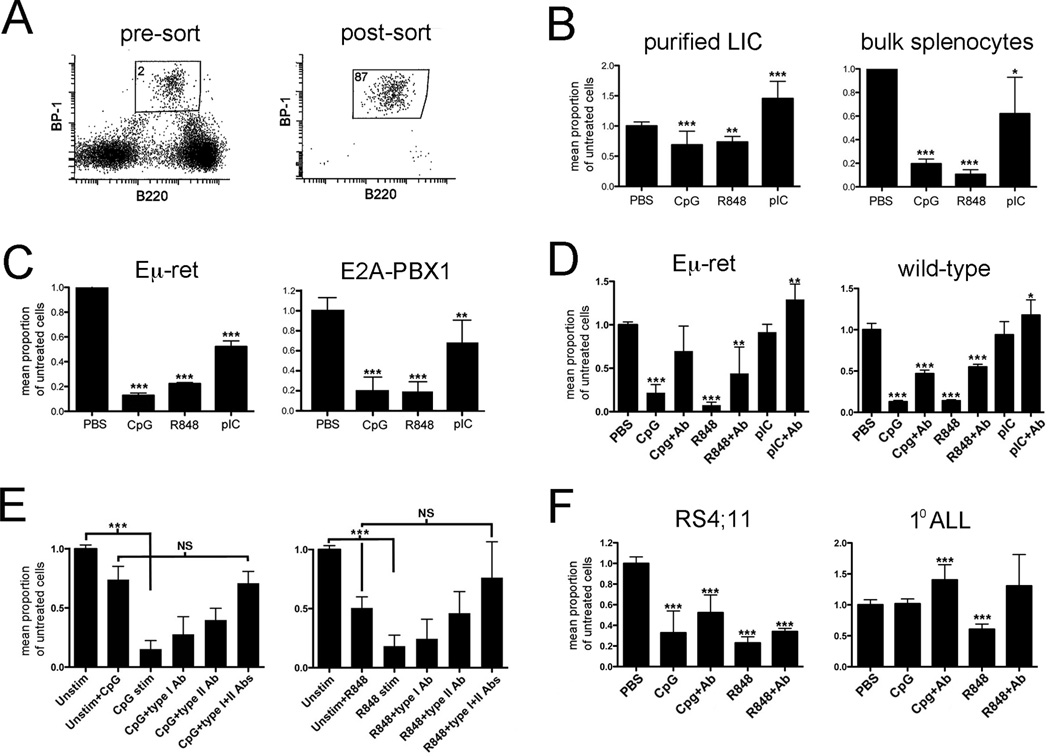
TLR ligands exert direct and immune-mediated effects on leukemia-initiating cells. A) Sorting strategy for purification of abnormal BCP cells from Eμ-ret spleens. There is no counterpart with this phenotype in transgene-negative mouse spleens. The percent of cells in BCP gated region is shown. B) Purified LIC or bulk splenocytes, from spleens of 4 to 6-week-old Eμ-ret mice, were cultured for 48 hours in the presence of the indicated TLR ligands and the number of viable BCP counted. Cumulative results of 4 and 7 independent experiments, respectively, are shown. C) Eμ-ret LIC (CD43+/B220int/BP-1hi) and E2A-PBX1 LIC (GFP+/B220int/BP-1hi) obtained from healthy mice were cultured with NSG bone marrow cells and indicated TLR ligands for 48 hours and then evaluated for viable BCP numbers. Cumulative results from 3 independent experiments are shown. D) Bone marrow cells from 4-week-old mice were stimulated with the indicated TLR ligands for 48 hours in the absence or presence of anti-IFN-α receptor and anti-IFN-γ antibodies (+Ab). Normal (CD43+/B220int/BP-1+/CD24+) and abnormal (CD43+/B220int/BP-1hi) BCP were counted in wild-type and Eμ-ret cultures, respectively. Cumulative results from 7 mice are shown. E) Purified Eμ-ret LIC were cultured for 48 hours in supernatant obtained from 24-hour cultures of BALB/c bone marrow cells stimulated with either TLR9 ligand (CpG, left panel) or TLR 7/8 ligand (R848, right panel). IFN-α receptor (type I) or IFN-γ neutralizing (type II) antibody or both were added at the start of the 48-hour BCP cell culture. Cumulative results from 4 independent cultures are shown. F) Human BCP ALL cell line RS4;11 and a primary BCP ALL sample were cultured in media conditioned with supernatant from 24-hour TLR-stimulated PBMC. The graph depicts pooled results from all donors. In all panels, results are presented as number of viable cells in treated sample as a ratio of number of viable cells in unstimulated control. Unless otherwise shown, significance of difference from control is indicated (* denotes p<0.5, ** p<0.01, *** p<0.001).

