
Figure 2.
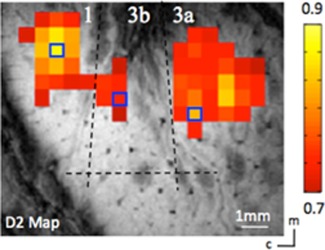
Localization of digit regions with fMRI mapping in the S1 cortex of squirrel monkeys. One case is shown here. BOLD activation in response to vibrotactile stimulation of the D2 tip. Activated voxels are observed in areas 3a, 3b, and 1. Correlation maps were thresholded at r > 0.7, with a peak correlation value of 0.9. Dotted black line indicates approximate inter‐area borders. Blue boxes show the seed voxels. Scale bar, 1 mm. c, caudal; m, medial. [Color figure can be viewed at http://wileyonlinelibrary.com]