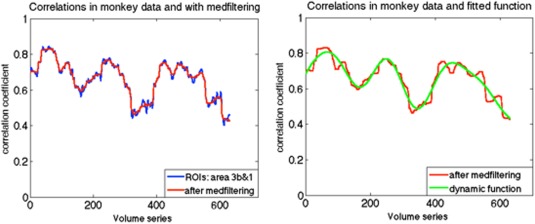
Figure 4.

(a) Example of correlations between sub‐regions area 3b and 1 in one monkey using the sliding window technique with a window size of 135s, along with a median filtering smoothing. (b) Example of fitted underlying correlation function: a sum of sines, the number of terms is 4. [Color figure can be viewed at http://wileyonlinelibrary.com]
