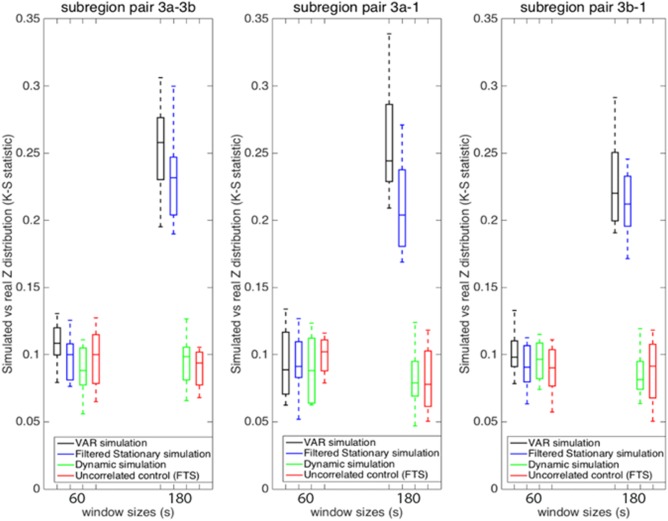
Figure 8.

Group analysis on K‐S statistic between functionally related monkey data and the VAR, filtered stationary, underlying dynamic models, along with K‐S statistic between functionally unrelated monkey data and the filtered stationary model at window sizes 60s and 180s. Sliding window correlations in real data differed from stationary simulations only at the longer window size, as shown by the high K‐S statistic (blue, black). Introducing a dynamic component to the simulation eliminated the difference (green), meaning that correlation distributions derived from dynamic simulations matched the real data. Sliding window correlations between two different monkeys’ time series (uncorrelated by construction) were reproduced well by the stationary simulations and served as the negative control (red). Error bars indicate standard deviations. [Color figure can be viewed at http://wileyonlinelibrary.com]
