
Figure 9.
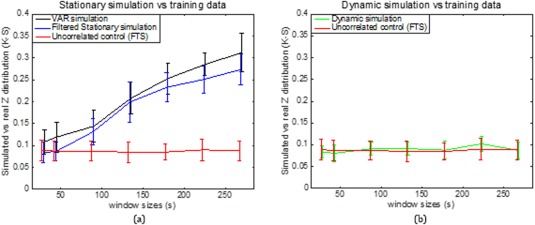
Group analysis on K‐S statistic between functionally related monkey sub‐region pair area 3a–3b and the stationary and dynamic models, along with K‐S statistic between functionally unrelated monkey data and the filtered stationary null model over a range of window sizes. Correlation distributions are indistinguishable from stationary simulations at the shortest window (30s) but begin to differ at longer windows (90s and up; blue and black). Dynamic simulations reproduce the correlation distributions of real data at all window sizes (green). Error bars indicate standard deviations. [Color figure can be viewed at http://wileyonlinelibrary.com]