
Figure 10.
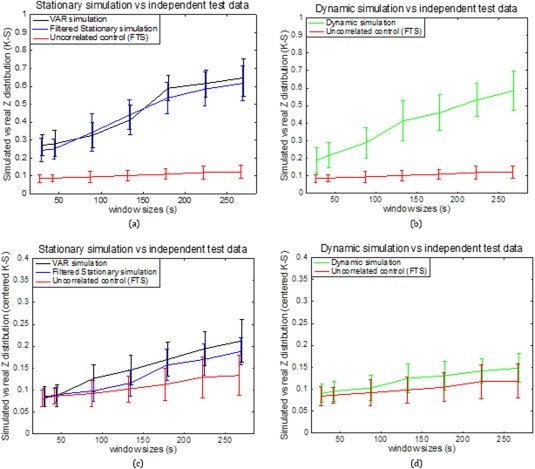
Group analysis on K‐S statistic between sub‐region pair area 3a–3b within different monkeys and the stationary and dynamic models before (a, b) and after (c, d) centering the z‐score. Error bars indicate standard deviations. [Color figure can be viewed at http://wileyonlinelibrary.com]