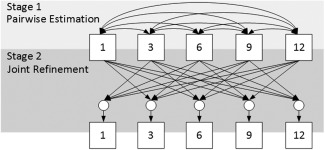
Figure 4.

Overview of the proposed method for estimation of missing data. The box with number stands for the data at the corresponding time point. The directed edges represent the processes of estimation of the missing data at the target time points (as pointed by the arrowhead) based on the data at the available time points (at the tail side). In Stage 1, the edges are bidirectional, which means that the estimation is performed twice by exchanging between the input and the output time points. The circles in Stage 2 denote the use of multiple time points jointly.
