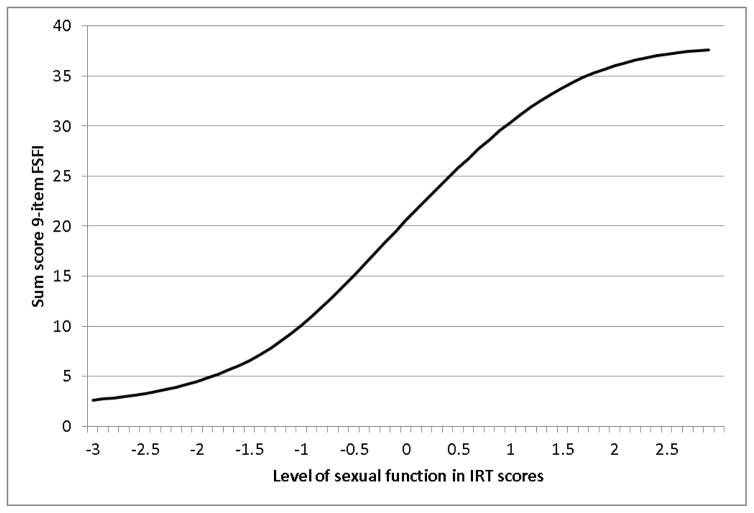
Figure 2.
Test Characteristic Curve for FSFI-9 Item
This curve shows the conversion of each item response theory (IRT) score (mean of 0 and standard deviation of 1) to the corresponding 9-item FSFI summed score (ranges from 2 to 45). For example, an IRT score of 0 corresponds to a summed score of about 20 and an IRT score of −0.5 corresponds to a summed score of 15.

