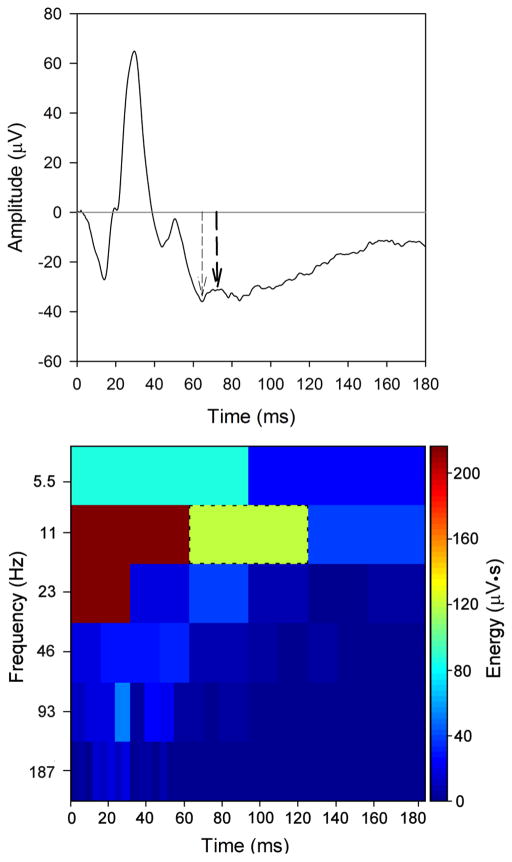
Figure 1.
The top panel shows the mean photopic single-flash ERG waveform obtained from the 20 subjects. The PhNR defined at the trough following the b-wave is indicated by the left arrow (thin dashed) and the PhNR defined at 72 ms is indicated by the right arrow (thick dashed). The DWT of the mean waveform is shown in the bottom panel. Energy (given by the scale at right) for each time-frequency bin is shown. The PhNR component corresponds to the 11 Hz, 60 – 120 ms bin (green bin; indicated by the black dashed outline).

