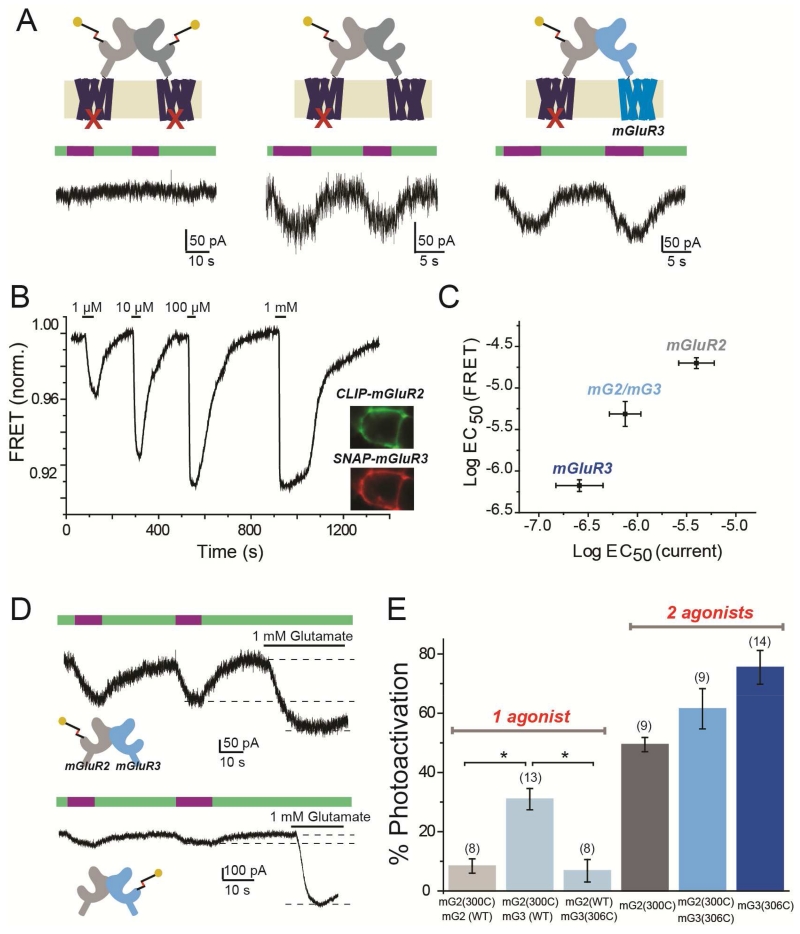
Figure 7. mGluR2/mGluR3 heterodimers exhibit trans-activation, intermediate glutamate affinity, and assymmetric cooperativity.
(A) LimGluR2(F756D) G protein coupling mutant has no photocurrent (left), unless co-expressed with mGluR2WT (middle) or mGluR3WT (right).
(B) Representative trace showing glutamate-induced decreases in ensemble FRET between co-expressed CLIP-mGluR3 (labeled with donor) and SNAP-mGluR2 (labeled with acceptor) in a HEK293T cell. Inset shows cell donor (CLIP-mGluR3) and acceptor (SNAP-mGluR2) fluorescence images.
(C) Summary of glutamate EC50 determinations from measurement of GIRK activation (current) versus LBD conformational change (FRET) for mGluR2, mGluR3, and mGluR2/mGluR3 (“mG2/mG3”). FRET for mG2/mG3 obtained from co-expression, as in (B); GIRK current from tandem linked mGluR2-mGluR3 (“mG2-mG3”).
(D) GIRK current traces showing single-subunit photoactivation of linked mG2-mG3 heterodimers via photoactivation of only mGluR2 (top) or only mGluR3 (bottom).
(E) Summary of photoactivation (from left to right) with 1 subunit liganding of mGluR2 in mG2-mG2, in mG2-mG3, or 1 subunit liganding of mGluR3 in mG2-mG3, or 2 subunit labeling in unlinked mGluR2, linked mG2-mG3 or unlinked mGluR3. * indicates statistical significance (unpaired t-test, p=0.003 between mG2(300C)-mG2(WT) and mG2(300C)-mG3(WT); p=0.004 between mG2(300C)-mG3(WT) and mG2(WT)-mG3(306C). The numbers of cells tested for each condition are shown in parentheses.
Error bars show S.E.M. calculated from multiple experiments (N≥3).

