
Figure 2.
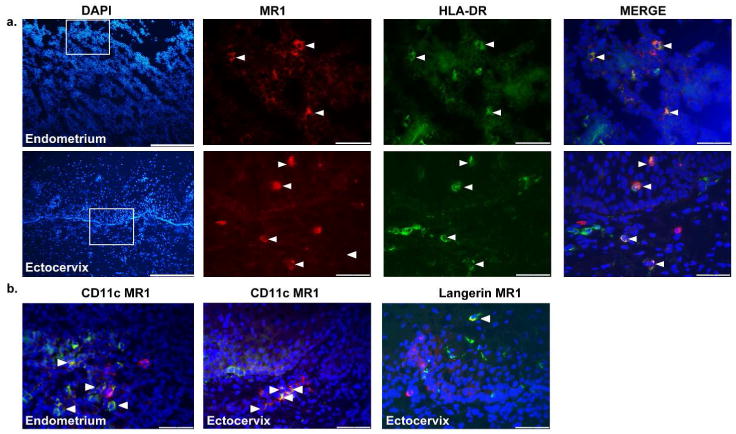
Localization and spatial distribution of MR1+ APCs in the endometrium and ectocervix. Representative immunofluorescence images of endometrial (n=2) and ectocervical (n=2) tissue sections stained for (a) MR1 (red) and HLA-DR (green); the scale bars are 250 μm in the images in the first column and 60 μm in the images in the other three columns. (b) Representative immunofluorescence images of endometrial and ectocervical tissue sections stained for MR1 (red) with CD11c (green) and MR1 (red) with Langerin (green); the scale bars are 60 μm. Double-positive cells are shown in yellow and are indicated by the white arrows. DAPI (blue) was used as a counterstain for visualization of cell nuclei. The images were collected with 10× and 40× objectives.