Fig. 1.

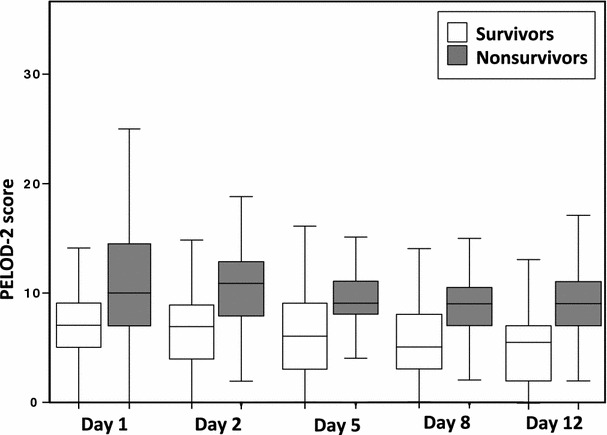
Boxplot of the PELOD-2 score on days 1, 2, 5, 8, and 12, among survivors (white) and non-survivors (gray). On each study day, PELOD-2 scores were significantly different between survivors and non-survivors

Boxplot of the PELOD-2 score on days 1, 2, 5, 8, and 12, among survivors (white) and non-survivors (gray). On each study day, PELOD-2 scores were significantly different between survivors and non-survivors