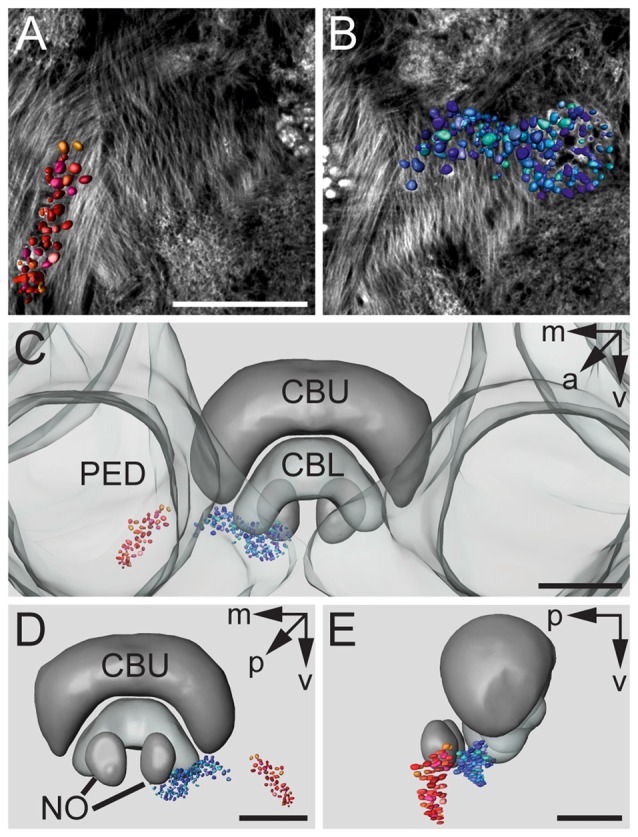
Figure 3.

3D reconstructions of f-actin phalloidin labeled microglomerular synaptic complexes. (A) Reconstruction of the cluster (red) in the LBU. (B) Reconstruction of the synaptic complexes in the MBU (blue). (C) 3D reconstruction of the microglomerular synaptic complexes and their spatial distribution in relation to the PED and the CBU and CBL. (D) View from posterior reveals the distribution of the clusters in relation to the CB and the noduli (NO). (E) Sagittal view shows the location of the clusters in anterior-posterior axis extending to the NO. Scale bars: A,B = 50 μm, C–E = 70 μm.
