Figure 4.
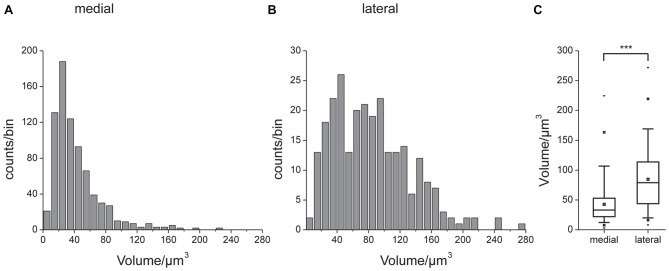
Volumes of the reconstructed f-actin positive postsynaptic portion of the microglomeruli. Unilateral data from four brains. Histograms of data from the medial (A) and lateral (B) cluster. Note different scaling in (A,B). (C) Comparison of volume data. Box: 25th, 50th and 75th percentile, small square: average, whiskers: 5th and 95th percentile, cross: 1st and 99th percentile, dash: minimum and maximum value. The median microglomerulus volume in the medial cluster was 33 μm3, whereas it was 79 μm3 in the lateral cluster. This difference was statistically significant (indicated by ***, Mann-Whitney test, P < 0.0001, U = 157060.5, z = −13.39, n = 4, Nmedial = 772, Nlateral = 262).

