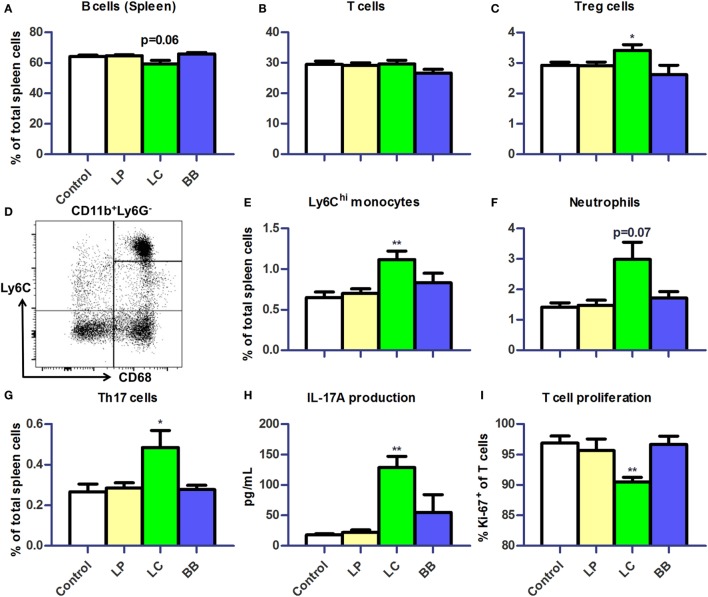
Figure 6.
L. casei supplementation of Ercc1−/Δ7 mice raised inflammatory markers in spleen. (A,B) Mean frequencies of B and T cells in spleen were determined by flow cytometry. B cells were defined as CD19+, T cells were defined as CD3+. (C) Mean frequencies of Treg cells in spleen. (D) Flow cytometric analysis of splenic monocytes. CD11b+Ly6G−CD68+ cells were divided in Ly6Chi, Ly6Cint, and Ly6Clo monocytes. (E–G) Mean frequencies of Ly6Chi monocytes, neutrophils, and CD3+CD4+CD8−Rorγt+ Th17 cells were determined by flow cytometry. (H) Mean concentration of IL-17A production by splenocytes stimulated with ConA for 4 days, as determined by Cytometric Bead Array. (I) Mean proliferating T cells (Ki-67+) in splenocyte culture stimulated with ConA for 4 days, as determined by flow cytometry. Data represent the mean + SEM from four to six animals per group. *p < 0.05; **p < 0.01. LP, L. plantarum WCFS1; LC, L. casei BL23; BB, B. breve DSM20213.

