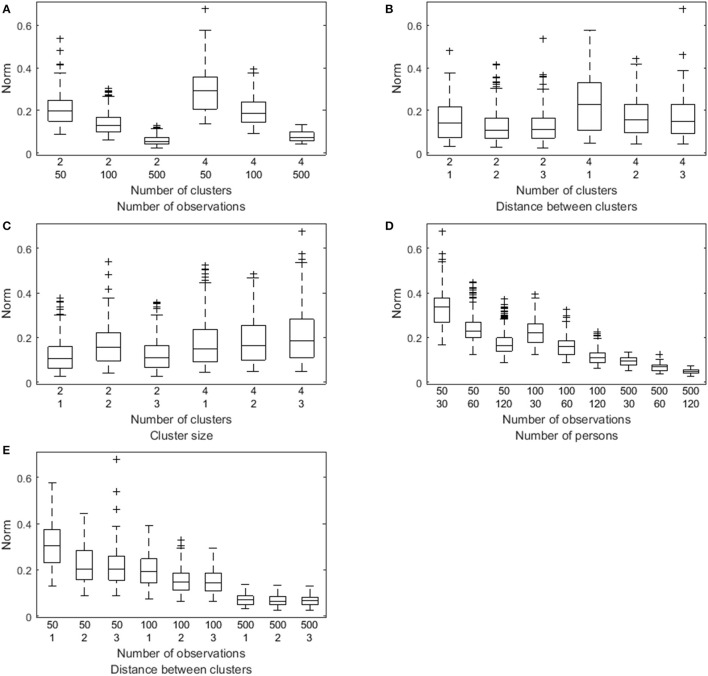
Figure 5.
Box plot of the Euclidian distance (denoted Norm) between the true and the estimated VAR(1) coefficients as a function of both the number of clusters and the number of observations (A), of both the number of clusters and the distance between the clusters (B), of both the number of clusters and the relative cluster sizes (C), of both the number of time points per person and the number of persons (D), and of both the number of observations per person and the distance between the clusters (E).

