
Figure 9.
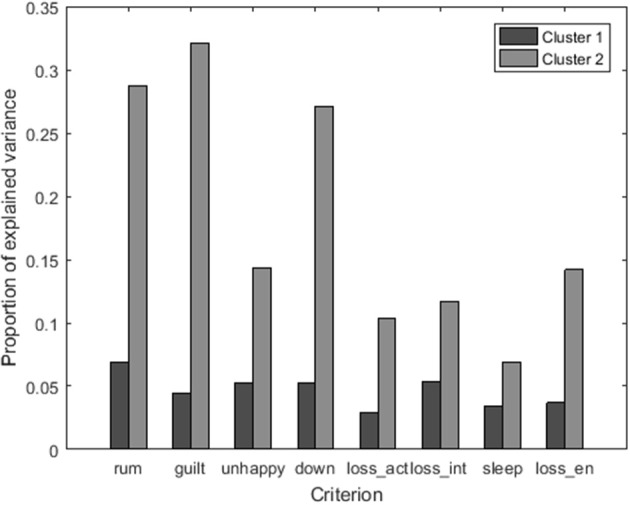
Bar plot of the proportion of explained variance R2 for each of the eight symptoms, using the following labels: rum, rumination; guilt, feeling guilty; unhappy, feeling unhappy; down, feeling downhearted; loss_act, loss of activation; loss_int, loss of interest; sleep, sleep quality; and loss_en, loss of energy.