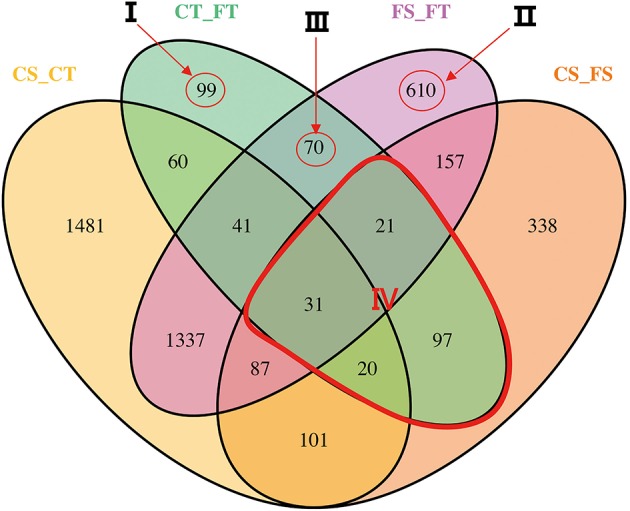
Figure 3.

Profile of differentially expressed genes (DEGs). The differentiations were compared between inbred lines under each freezing treatment, or between freezing treatments in each inbred line. Freezing treatments are labeled Control (C) and Freezing (F). The tolerant line (KR701) and sensitive line (Hei8834) are labeled “T” and “S,” respectively. The four treatment-line biological samples are control-tolerant (CT), freezing-tolerant (FT), control-sensitive (CS), and freezing-sensitive (FS). Each compared combination is separated by an underscore (e.g., CT_FT). In the Venn diagram, the numbers of DEGs are illustrated across the intersection areas among the compared combinations. In total, we found 4550 DEGs from all the areas. Some of the areas are more important than others. Four critical areas, labeled I, II, III, and IV, totally contain 948 DEGs. Area I contains the tolerant treatment response (TTR) DEGs, excluding others. Area II contains the line response under freezing (LRF) DEGs, excluding others. Area III contains both tolerance treatment response and line response under freezing (TRLR) DEGs, excluding others. Area IV contains the treatment response (TR) DEGs within line.
